
As the US-Iran war and related Middle Eastern disruptions come to an end with an imminent signing of a Peace Accord this week, its time to take a re-look at the impact, this standoff has had on the global animal feed commodities market and likely potential gains ahead.
The escalation of conflict involving Iran emerged as one of the most significant macroeconomic risks facing global agriculture during 2026 apart from sporadic outbreaks of diseases and looming threat of El Nino. Although Iran is not itself a major exporter of corn or soybeans, the conflict affected animal feed markets through five primary transmission channels:
-
Crude oil and refined fuel prices
-
Fertiliser production and pricing
-
Ocean freight and marine insurances
-
Grain trade logistics through the Middle East
-
Currency volatility and import financing
With the cessation of hostilities and signing of the peace agreement – a majority of these cost excursions are expected to taper down. Global crude prices are already headed lower at the time of this news write up with Brent Crude was trading down almost 5% at USD 83.37 per barrel.
Feed accounts for approximately:
| Sector | Feed Cost Share of Production Cost |
|---|---|
| Broiler | 65–70% |
| Layer | 60–65% |
| Swine | 60–70% |
| Dairy | 45–60% |
| Aquaculture | 50–65% |
Even modest increases in feed ingredient prices can materially affect livestock profitability.
1. Global Feed Industry at a Glance
| Indicator | Estimated Value (2025/26) |
|---|---|
| Global compound feed production | ~1.42 billion tonnes |
| Global feed industry value | US$520–560 billion |
| Global soybean meal consumption | ~285 million tonnes |
| Global corn use for feed | ~780 million tonnes |
| Global wheat use for feed | ~165 million tonnes |
Sources: USDA WASDE, Alltech Agri-Food Outlook, FAO.
2. How the Conflict Affected Feed Markets
Iran Conflict
      ↓
Higher Crude Oil Prices
      ↓
Higher Marine Fuel Costs
      ↓
Higher Ocean Freight
      ↓
Higher Imported Feed Ingredient Costs

           +

Natural Gas Volatility
      ↓
Higher Ammonia Production Costs
      ↓
Higher Urea Prices
      ↓
Higher Crop Production Costs
      ↓
Higher Grain Prices
      ↓
Higher Feed Manufacturing Costs
3. Commodity Impact Assessment
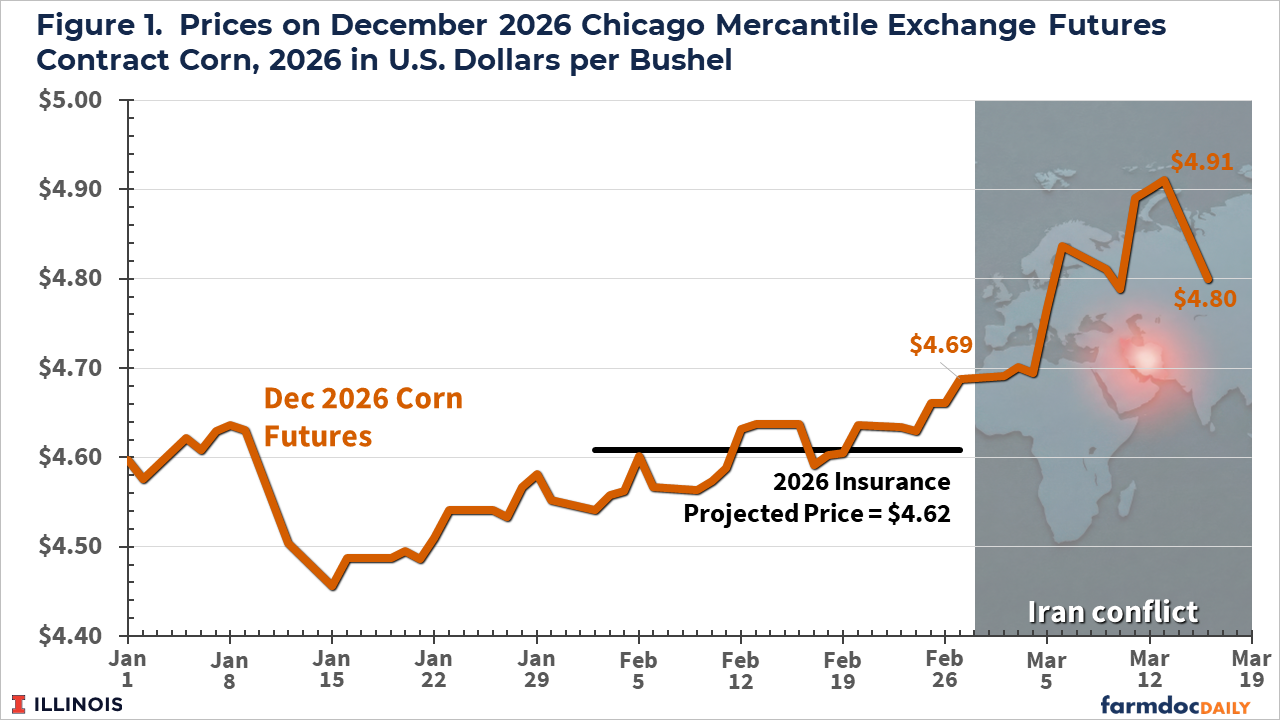
Corn – Corn remains the world’s largest feed grain
| Item | Approximate Annual Volume |
|---|---|
| Global Production | ~1.27 billion tonnes |
| Feed Consumption | ~780 million tonnes |
Impact witnessed which may start tapering off
| Scenario | Price Impact |
|---|---|
| 3-month conflict | +6% to +10% |
| Hormuz disruption | +10% to +18% |
Drivers
-
Freight inflation
-
Currency movements
-
Speculative buying
-
Higher fertiliser costs
Soybeans – Brazil is expected to harvest a record 180.25 million tonnes in 2025/26, helping cushion global supply.
| Country | Production (Mt) |
|---|---|
| Brazil | 180.25 |
| USA | ~119 |
| Argentina | ~50 |
Impact Witnessed
Despite abundant supply, export logistics and shipping costs affected the delivered prices, particularly in Asia which are expected to cool off.
Soybean Meal – The most important protein ingredient in livestock diets.
| Region | Market Exposure |
|---|---|
| India | High |
| China | Very High |
| Southeast Asia | Very High |
| Middle East | High |
Price Sensitivity – Every 5% increase in soybean meal prices can increase broiler feed costs by approximately 2–3%, depending on formulation. With expected drops in freight rates, international prices are expected to see a slight dip
Wheat – Wheat competes with corn in feed formulations based on prevalent prices
Higher freights due to Iran war, did increase wheat inclusion in some regions while reducing competitiveness in others and now with peace accord, corn could regain its place in feed formuale
4. Fertiliser Market – Natural gas is the largest variable cost in nitrogen fertiliser production
| Fertiliser | Primary Feedstock |
|---|---|
| Urea | Natural Gas |
| Ammonia | Natural Gas |
| UAN | Natural Gas |
Middle Eastern producers account for a significant share of global nitrogen fertiliser exports and hence disruptions in supplies tightened global supplies and raised crop production costs which now are expected to cool off.
5. Ocean Freights – Approximately one-fifth of global seaborne oil trade passes through the Strait of Hormuz. Disruptions to this trade route increased:
-
Bunker fuel costs
-
Marine insurances
-
Charter rates
-
Transit times
Shipping Cost Impacts witnessed
| Item | Change |
|---|---|
| Bunker fuel | +15–30% |
| War-risk insurance | +50–200% |
| Bulk freight | +10–25% |
Now with the expected opening of Strait of Hormuz, some of these costs increases are expected to taper down helping animal feed producers with potentially lower feed commodities’ prices.
6. Impact on Feed Manufacturing
Overall feed cost increase was: ~6–10% over the last 3 months and with the halt to hostilities, feed manufacturers’ can expect at least 4 to 5% reduction in commodity prices and a proportionate reduction in overall feed costs.
7. Regional Exposure
| Region | Risk Level | Main Concerns |
|---|---|---|
| India | High | Imported edible oils, freight, fertilisers |
| China | Medium | Soybean imports |
| EU | High | Energy costs |
| Middle East | High | Import dependence |
| Brazil | Low–Medium | Freight |
| USA | Low | Domestic grain supply |
8. India: Feed Industry Assessment
India produces an estimated 45–50 million tonnes of compound feed annually.
Major Segments
| Segment | Estimated Share |
|---|---|
| Poultry | ~60% |
| Dairy | ~25% |
| Aquaculture | ~10% |
| Swine & Others | ~5% |
Key Vulnerabilities
-
Imported edible oils
-
Fertilizer costs
-
Freight
-
Energy
-
Soybean meal price volatility
Animal Feed Manufacturers in India stand to gain most with the expected improvement in global supply chains and lower freight costs.
9. Corporate Exposure
| Company Type | Relative Exposure |
|---|---|
| Feed manufacturers | High |
| Poultry integrators | High |
| Dairy processors | Medium |
| Grain traders | Mixed |
| Fertiliser producers | Potential beneficiaries |
| Feed additive companies | Moderate |
10. Scenario Analysis
With the stopping of Iran Conflict – the Key Factors to Monitor by animal feed manufacturers and integrators’ are:
-
Crude oil benchmarks (Brent, WTI)
-
Natural gas prices
-
Urea export prices
-
Corn and soybean futures (CBOT)
-
Soybean meal futures
-
Baltic Dry Index
-
Marine insurance premiums
-
Export restrictions by major grain-producing countries